Leaderboard


Popular Content
Showing content with the highest reputation on 11/22/2015 in Posts
-
And the crowd goes wild!2 points
-
Question to any and all bigfoot hunters on the board: How many bigfoot do you hunt/capture on a monthly basis? How do you gauge your successes and failures? Is there a monthly quota in bigfoothunting?1 point
-
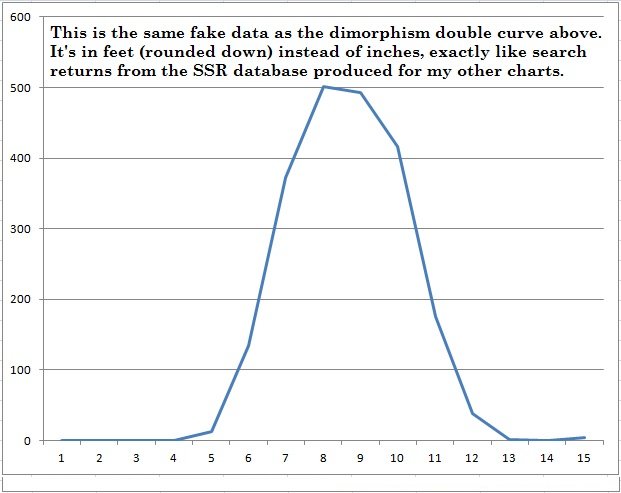
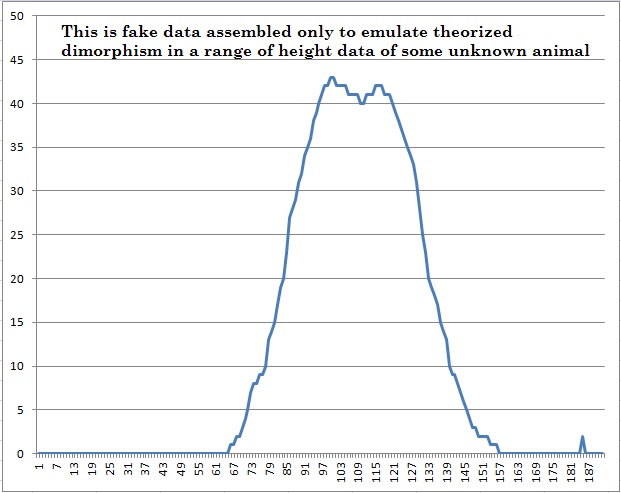
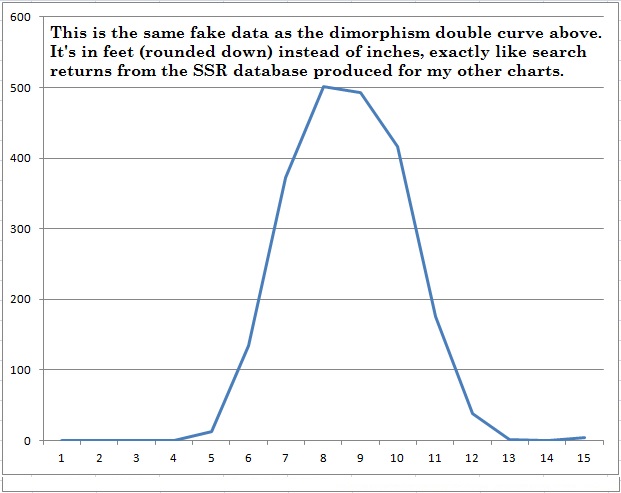
I'm sorry for the long length and if this post drifts off topic but I felt it would be fair to respond. So you would expect a curve that looks something like this? (This graph represents contrived data, for demonstration purposes, unrelated to any sightings database anywhere. It was only assembled to demonstrate a set of data that may be indicative of dimorphism among a sampling of some tall unknown animals. This data is in Inches.) I would try to determine if that blip at 185 inches is statistically significant, except for the fact that I really don't care. If it's important to somebody they can figure it out for themselves. This may be found to be true when science has collected enough specimens to measure height accurately, within an inch of actual height. Unfortunately our SSR database is much less specific than that. Few reports give a height that is measured in inches. It sort of appears that the double bell curve changes to a Gaussian curve when the Same Data is presented in feet (rounded down) instead of inches. I guess what I have shown COULD be representative of a unknown primate population that shows traits of dimorphism after all! Does it? I have no way of knowing with our presently available data. Coincidentally, all of the height data I used for SSR database graphs in this thread are in feet, rounded down, because that is the search functionality that was available to me at the time. I had to go with what was available. (This graph represents contrived data, for demonstration purposes, unrelated to any sightings database anywhere. It is the same data as used in the graph above, but shown in feet, rounded down, instead of inches) When I am in the woods I carry a tape measure. Eventually, when I get a good sighting I will ask Sasquatch to hold still while I measure. We'll get this dialed in! I still eagerly await the review of my work in this thread by others so that I can learn from my mistakes and possibly become a better person.

 1 point
 -
Thanks for the unsolicited advice. I'm chose to play pop-up target, and it probably wasn't a good idea. But we did learn something, didn't we? These guys will go beyond proselytizing. They will go beyond the subjective dismissal of any and all evidence to the point of irrationality. And, given a chance, they will even go so far as to attempt character assassination of other forum members. I do apologize to the other proponents and objective skeptics on the forum for the distraction.1 point
-
Go back and look about how it was "asked for". Also look at the recent demands for personal information regarding my career. The demands have hardly been wholly respectful. Further, I have no obligation to meet the demands of anyone who is not sincerely interested in objective discussion.1 point
-
It seems rather coincidental that you developed an interest in bigfoot and then found tracks in your backyard.1 point
-
I came to this site some 8 years ago as a hardcore proponent of BF. As a result of this site plus other research I have moved to being on the fence. My main thought being, given all the groups out there looking for this thing ( BFFO, GCRO, NAWAC + others ). If the best thing we truly have is the PGF at this point for visual evidence that's not enough for me yet. All the anecdotal evidence in the world does not add up to proof to me at this point. In this day and age people can read all the stereotypical ideas of a Bigfoot and make a report that fits the mold of a typical Bigfoot. Now because their report fits the "mold" it's plausible. Sad as it is to say, I believe In the ability of a person to lie than an 8' primate in America.1 point


This leaderboard is set to New York/GMT-04:00